AI dashboards built with Claude live artifacts are dynamic, personalized interfaces that unify real-time data from multiple SaaS platforms into a single operational view - replacing the fragmented tab-switching workflows that cost mid-market teams hours every day. Recent capability rollouts confirm that AI is no longer just a chatbot layer; it is becoming the primary business operating system.
The deployment of Claude live artifacts marks a fundamental turning point in how organizations interact with their software stack. For years, scaling businesses have been caught in a relentless cycle of SaaS fragmentation. Employees spend hours jumping between disconnected applications, manually aggregating data, and fighting with one-size-fits-all user interfaces that rarely match their specific operational workflows. This challenge is at the heart of the AI adoption gap between experimentation and real workflow automation.
AI is rapidly becoming the primary business operating system. By enabling the creation of personalized, real-time AI dashboards that pull and interpret data across multiple siloed applications, AI interfaces are threatening to replace traditional native SaaS interfaces entirely.
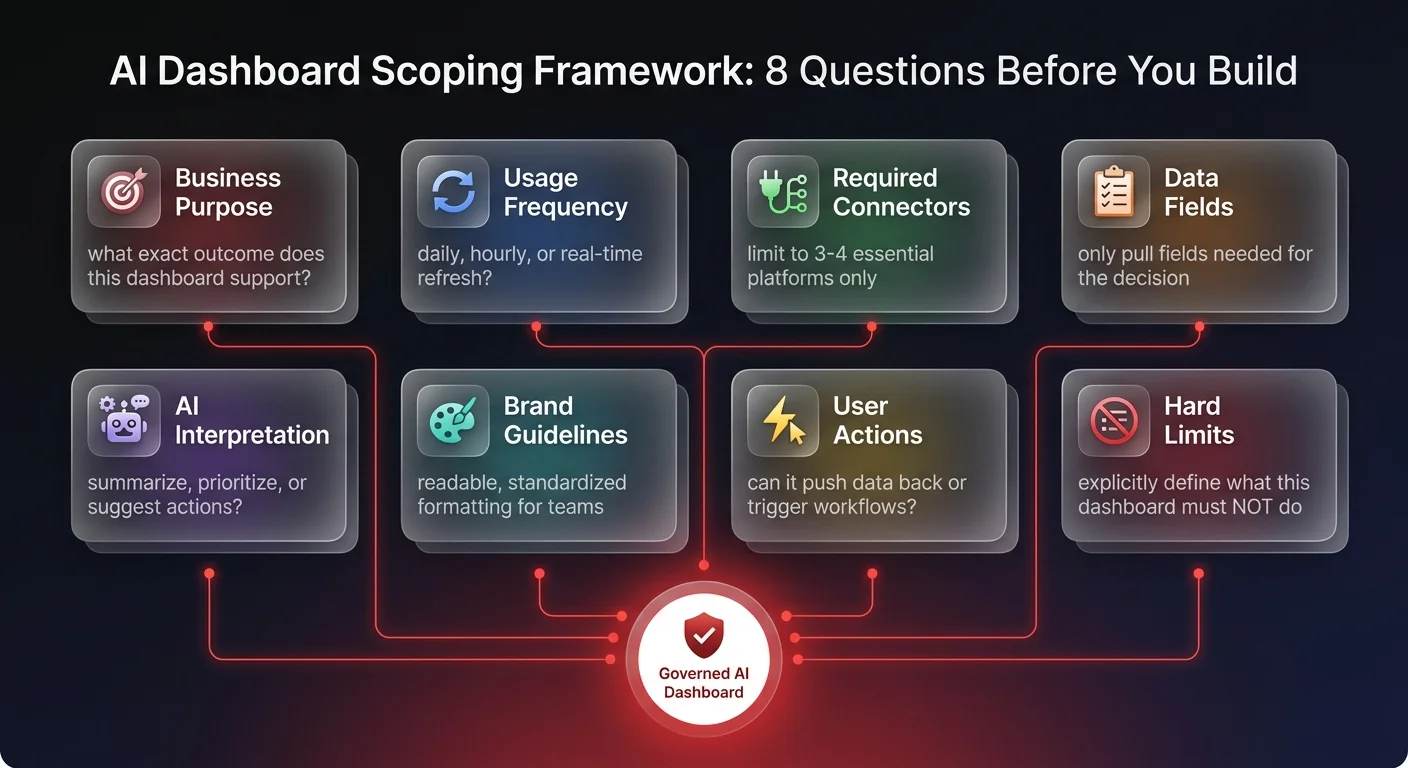
For CEOs, COOs, and operations leaders, understanding this shift is critical. The ability to centralize intelligence without undertaking massive software migration projects offers a clear path out of operational gridlock. However, it also introduces new governance challenges that require a strategic, solution-focused approach.
The SaaS fragmentation crisis and AI dashboards as the solution
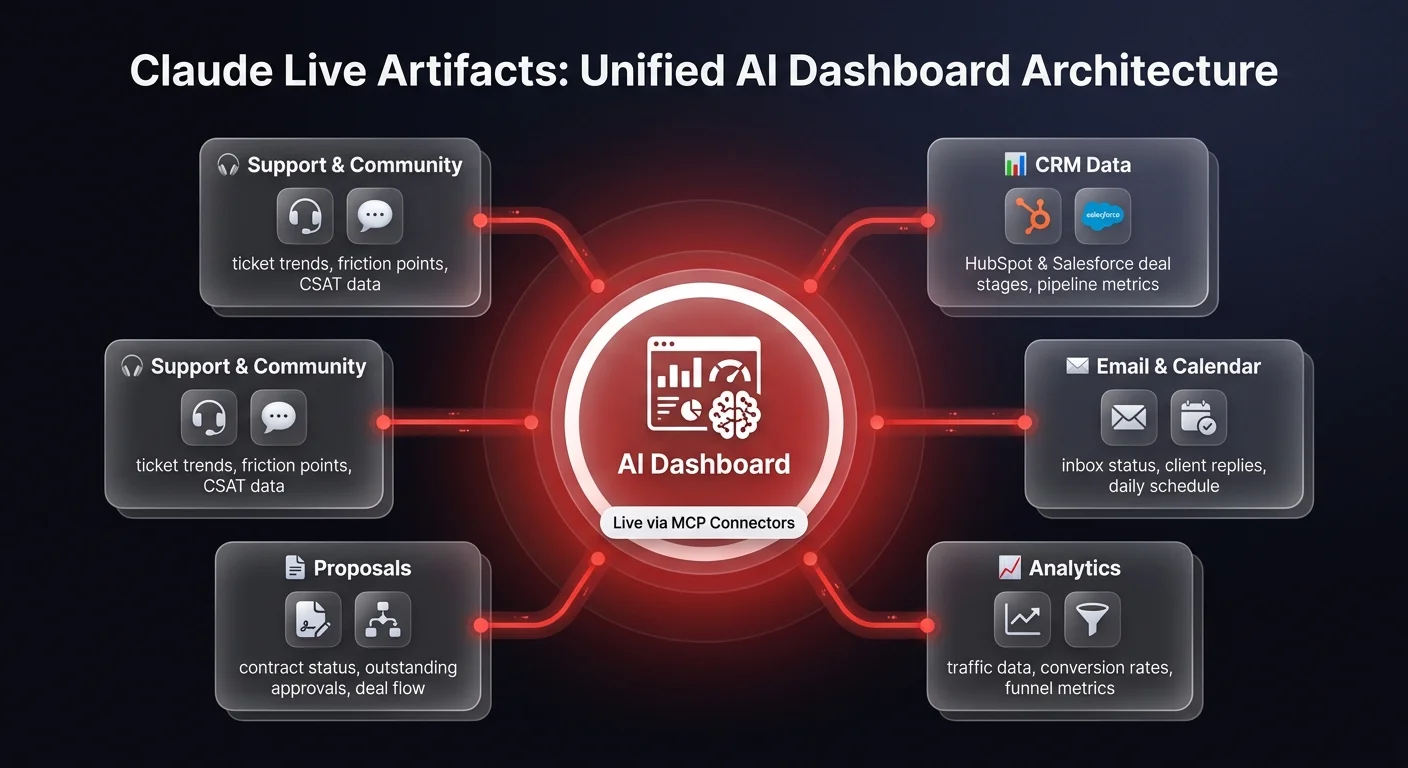
Consider the typical morning routine of a revenue operations professional or a mid-market sales representative. To simply understand where their day should begin, they must log into a CRM (HubSpot, Salesforce, or their system of choice) to check deal stages, open an inbox to read client replies, check a calendar for availability, and log into a proposal tool to verify the status of outstanding contracts.
This workflow is entirely broken. The human worker is acting as the integration layer between heavily funded, sophisticated software tools.
Live AI dashboards offer an immediate remedy to this fragmentation. By utilizing Model Context Protocol (MCP) and secure API connectors, an organization can build a customized interface once, and have it automatically refresh with live data every time it is opened. Instead of hopping between five different browser tabs, the professional is presented with a singular, unified view of their day.
The true value lies in the personalization. Traditional SaaS providers are forced to build universal interfaces designed to satisfy millions of users across thousands of industries. A live AI artifact, conversely, is built specifically for the individual role, presenting only the exact data required for that specific business outcome. This mirrors the broader shift toward AI context infrastructure replacing generic chat-based interactions with purpose-built business operating systems.
How Claude live artifacts change the data paradigm
To understand the strategic implications, operations leaders must understand the mechanics. Artifacts themselves are not a new concept in the AI space, but the introduction of live, dynamic data pulling fundamentally changes their utility.
In a standard AI deployment, a user might export a CSV from a platform, upload it to an AI model, and ask for an analysis. With live artifacts, the workflow is entirely automated. You build the dashboard structure once alongside the AI. You then configure the necessary software connectors. Every subsequent time the dashboard is accessed, it pulls up-to-date data directly from the integrated software - whether that is YouTube analytics, link tracking, or product metrics.
This cross-platform unification generates insights that single tools simply cannot provide. For example, a marketing team can deploy a dashboard that cross-references video engagement data alongside specific product conversion metrics, tracking the entire funnel from initial view to final retention in one seamless view.
Moving from data visualization to active intelligence
If these AI dashboards only visualized raw data, they would merely be competing with established business intelligence tools. The differentiator is that AI actively interprets the data streams to provide immediate, actionable intelligence.
Industry applications have demonstrated remarkable capabilities when data interpretation is layered over data visualization:
Business intelligence and strategic routing
Dashboards can pull live financial data from payment processors alongside traffic data from analytics platforms. Instead of just displaying KPIs, the underlying AI analyzes the trends and provides strategic suggestions on the dashboard itself, highlighting areas where revenue is dropping or where conversion friction is highest. Teams focused on operations automation can use this approach to consolidate decision-making into a single governed surface.
Customer support triage and community intelligence
Support and community management teams often struggle to identify systemic issues buried within individual support tickets. By pulling data from transcription tools, customer support ticketing systems, and community platforms, an AI dashboard can track the most common friction points over a given period. An operations manager can actively chat with the live dashboard, asking specific questions like, "What exact problems are users experiencing with our new integration setup?" The AI instantly reads the live data and summarizes the top friction points.
Competitor and market intelligence
Many organizations run scheduled tasks to monitor competitors. These can be transformed into dynamic AI dashboards that track industry movements, keyword opportunities, and breakout content across the market, offering a real-time pulse on industry shifts without manual research.